Interactive Dashboard in Excel using Hyperlinks: "
Last week we learned how to create dynamic hyperlinks in Excel. Today, I want to show you something even cooler. An interactive dashboard based on hyperlinks, like this:

Isn’t it impressive?
Well, to create something like this, you don’t need a degree in advanced cryogenics. You just need a bunch of data, a chart, a one line macro code and some pixie dust (go easy on pixie dust).
It is no wonder that any good chart or dashboard exercise must begin with data setup. So, the first thing we need to do is, to set up our data.
If you observe carefully, you will realize that we just have one chart and we are changing the chart’s source data based on which option user selected.
So, assuming you have 4 series of data – sales, expenses, profits & number of customers, we will add fifth series. This will always show data for the series that user selected. Like this,
Lets call the series name in fifth column as “valSelOption“. Lets assume that we will use some sort of magic to change the series name.
Note: Using this series name, we can fetch the position of the series out of 4 with MATCH formula. Once you know the position, You can fetch corresponding values using INDEX() formula.
This is very simple. Just create a chart from the data in 5th column as above. You can format this as you want.
This is a bit tricky, but easy too. Just set up 4 column area (since we have 4 charts) such that you can place your chart and mouse-over cells for selection. like this,
Now comes the magical part. We need a simple macro or UDF to change the series based on where user pointed the mouse.
But how to activate that UDF on mouse rollover?
This is where we can use Hyperlinks.
Do you know that you can use a UDF as source for hyperlink.
Just like we can write =HYPERLINK(“http://chandoo.org/”,”Click here”)
we can also write =HYPERLINK(myFunction(),”Click here”)
And Excel would run your function when user clicks on the link.
But, there is more to it.
Excel would also run the function, when you place your mouse on the link. No need to click!
But, seasoned VBA programmers would know that Functions are not allowed to change values in other cells or format them. Well, that restriction does not apply if you use a function from Hyperlink!!!
So, we would write a one line function – highlightSeries(seriesName as Range) and put this code in there.
This function would take the series name as a variable and assigns it to named range valSelOption. As the valSelOption changes, so does the data for our chart and then we get new chart.
Now, we just write this hyperlink formula in all the 4 cells, like this:
(Assuming the series names in B3:E3)
Now, drag this formula sideways to fill in all 4 cells.
Note: Word-wrap the hyperlink cells so that the link works when you hover anywhere on the cell, not just the down-arrow symbol.
This is optional, but just as awesome. Once you add conditional formatting, the dashboard feels slick and interactive.
That is all. Your interactive dashboard is ready.
Click here to download the interactive dashboard workbook and play with it. Examine the technique, formulas and UDF code to see how it is weaved together.
Many thanks to Jordan, who blogged about this technique on his OptionExplicit VBA blog. He reviewed my file and gave me few suggestions too. He made an interactive snake application using this technique. You can download that file from here.
I like the possibilities of this technique. However, it is also a bit tricky to explain. So I will use it with caution. (Also, I am not sure if this would slow down Excel, but in my experience it did not)
What about you? Do you like this idea? Are you going to experiment with it? Please tell me how you are planning to use it thru comments.
If you work with Dashboards or data analysis, then you are at the right place. We have a wealth of information, tutorials, examples & ideas for you. Please check out a few below:


 "
"
Last week we learned how to create dynamic hyperlinks in Excel. Today, I want to show you something even cooler. An interactive dashboard based on hyperlinks, like this:
Isn’t it impressive?
Well, to create something like this, you don’t need a degree in advanced cryogenics. You just need a bunch of data, a chart, a one line macro code and some pixie dust (go easy on pixie dust).
5 Step Tutorial to Create Interactive Dashboard using Hyperlinks
Step1: Setup your data
It is no wonder that any good chart or dashboard exercise must begin with data setup. So, the first thing we need to do is, to set up our data.
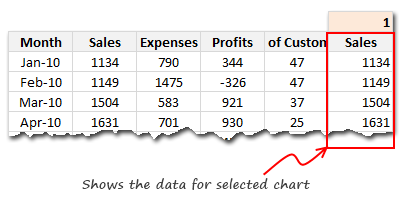
If you observe carefully, you will realize that we just have one chart and we are changing the chart’s source data based on which option user selected.
So, assuming you have 4 series of data – sales, expenses, profits & number of customers, we will add fifth series. This will always show data for the series that user selected. Like this,
Lets call the series name in fifth column as “valSelOption“. Lets assume that we will use some sort of magic to change the series name.
Note: Using this series name, we can fetch the position of the series out of 4 with MATCH formula. Once you know the position, You can fetch corresponding values using INDEX() formula.
Step 2: Create a chart from the series 5
This is very simple. Just create a chart from the data in 5th column as above. You can format this as you want.
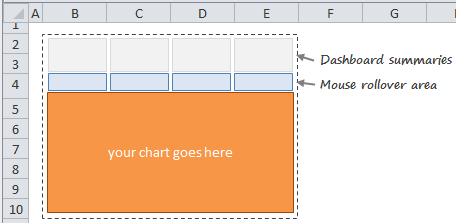
Step 3: Create the dashboard area
This is a bit tricky, but easy too. Just set up 4 column area (since we have 4 charts) such that you can place your chart and mouse-over cells for selection. like this,
Step 4: Create Roll-over effect
Now comes the magical part. We need a simple macro or UDF to change the series based on where user pointed the mouse.
But how to activate that UDF on mouse rollover?
This is where we can use Hyperlinks.
Do you know that you can use a UDF as source for hyperlink.
Just like we can write =HYPERLINK(“http://chandoo.org/”,”Click here”)
we can also write =HYPERLINK(myFunction(),”Click here”)
And Excel would run your function when user clicks on the link.
But, there is more to it.
Excel would also run the function, when you place your mouse on the link. No need to click!
But, seasoned VBA programmers would know that Functions are not allowed to change values in other cells or format them. Well, that restriction does not apply if you use a function from Hyperlink!!!
So, we would write a one line function – highlightSeries(seriesName as Range) and put this code in there.
Public Function highlightSeries(seriesName As Range)
Range(“valSelOption”) = seriesName.Value
End Function
Range(“valSelOption”) = seriesName.Value
End Function
This function would take the series name as a variable and assigns it to named range valSelOption. As the valSelOption changes, so does the data for our chart and then we get new chart.
Now, we just write this hyperlink formula in all the 4 cells, like this:
(Assuming the series names in B3:E3)
=IFERROR(HYPERLINK(highlightSeries(B3)),'6')Why this formula works?
- While using a UDF inside HYPERLINK() works the trick, Excel would also throw up a #VALUE! error. To fix it, we use the IFERROR()
- The number 6 is the down-arrow symbol in webdings font
- So, change the cell’s font to webdings!
Now, drag this formula sideways to fill in all 4 cells.
Note: Word-wrap the hyperlink cells so that the link works when you hover anywhere on the cell, not just the down-arrow symbol.
Step 5: Add Conditional Formatting to highlight selected series’ name etc.
This is optional, but just as awesome. Once you add conditional formatting, the dashboard feels slick and interactive.
That is all. Your interactive dashboard is ready.
Download the Example Workbook
Click here to download the interactive dashboard workbook and play with it. Examine the technique, formulas and UDF code to see how it is weaved together.
Special Thanks to Jordan:
Many thanks to Jordan, who blogged about this technique on his OptionExplicit VBA blog. He reviewed my file and gave me few suggestions too. He made an interactive snake application using this technique. You can download that file from here.
How do you like this technique?
I like the possibilities of this technique. However, it is also a bit tricky to explain. So I will use it with caution. (Also, I am not sure if this would slow down Excel, but in my experience it did not)
What about you? Do you like this idea? Are you going to experiment with it? Please tell me how you are planning to use it thru comments.
More techniques for Dashboard Makers & Analysts
If you work with Dashboards or data analysis, then you are at the right place. We have a wealth of information, tutorials, examples & ideas for you. Please check out a few below:
- Display on demand details in your excel charts
- Cricket World-cup Dashboard in Excel
- New to Dashboards? 33 Resources & Ideas for you
- Excel School Dashboards Program – Learn how to create dashboards using Excel
没有评论:
发表评论